
After reaching highs between October through March, things have slowed in the summer months. It will be interesting to see if this continues through the Fall.
 median home price for this county from June 2010 through May 2012:


USAA saw a large increase in their monthly originations in May and June to push ahead of Wells Fargo. Will they continue to have the staying power through the end of the year? Check back to our blog in a couple of months.
 This chart shows a slight increase in median home price in August 2011 from June 2010 but no real increase in home sales (we see the usual seasonal peaks and valleys) over that period. There is no bad news as there is in many other areas of the country. I will follow up on this area again with a blog article sometime next year to see if things are changing for the better.


It appears the news over the last twelve months is a little better. The median home price is about $30,ooo higher than a year and sales seem to be trending upward. I will keep an eye on this positive trend to see if it continues. Check our blog in the future to see if there is more good news for Fairfax County.

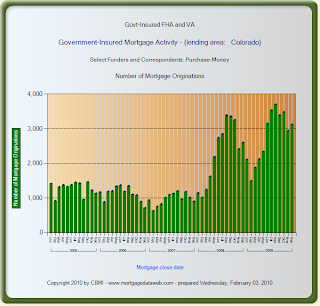
The number and dollar amounts for purchase mortgages have been trending upward for the last 12 months. Click on the image above for a larger view.

This will be a good geographic to monitor over the next six months to see what happens in the Spring 2011. Check back with our blog over the next few months to see if things improve for this area.

 After reaching a recent high in June, we have seen a steady monthly decline since that time. Is this just a seasonal adjustment as sales have slowed in the Fall or a trend? This bears watching in the coming months.

Will Buyers sell? Even though the median price has stayed at the relatively same level for the last 12 months - seasonal sales have continued to drop from 2009 levels in 2010. In March 2009, there were 2,425 homes sold as compared to 1,588 homes sold in March 2010.
What does it all mean?

We hope this positive sign shows in other places around the country in the remainer of the summer.

Notice that the March 2010 sales figure returned to apporximately the same level as March 2009. We will continue to monitor this trend (if it is a positive trend in future months). What are your thoughts?

We will monitor this and see what happens over the summer.
.jpg)


.jpg)


Is this a sign of improvement in sales coming next Spring? It is too early to tell. We will monitor this situation closely over the coming months and report back.


